
Microsoft Excel probably doesn’t pop in to most people’s minds for doing spectral analysis, and that’s no surprise since it’s somewhat of a kluge to do it. But Excel is good to use for a quick sanity check when you are working in a different environment (in this case with Octave/Matlab .m files) and need a simple verification.
Googling doesn’t seem to turn up a simple example so after creating a spreadsheet that had both forward and inverse transforms the extra stuff was removed and posted here.
This example illustrates how to use it. Excel seems to treat complex numbers a bit oddly so don’t worry about the funny little green triangles in the FFTand IFFT output columns. Excel can’t perform a DFT, it’s limited to using an FFT and therefor input data must be a power of 2 in size. If your data has less than a power of 2 in size you must pad it with actual zeros, you can not leave the cells blank. Other websites indicate the max size is 4096 but I did not try that.
If you haven’t already install the Data Analysis add in. By default it will appear on the data ribbon.

The FFT and inverse FFT (IFFT) aren’t functions, they are more like a tool that you have to select and run (which is what, IMHO, makes this all really awkward). Some people seem to have written scripts as a way around this.

After you select the Fourier Analysis option you’ll get a dialog like this.
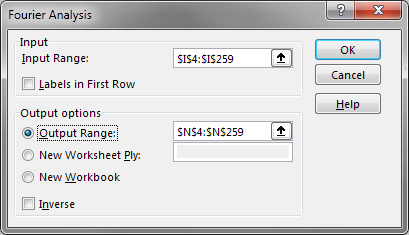
Enter the input and output ranges. Selecting the “Inverse” check box includes the 1/N scaling and flips the time axis so that x(i) = IFFT (FFT (x(i)))
The example file has the following columns:
- A: Sample Index
- B: Signal, a sinewave in this example
- C: Some random noise
- D: Sum of signal + noise
- F: Hamming window, used to emulate a more realistic use case for a FFT
- G: The (Hamming) windowed data, used as the input to the FFT
- I: The FFT of Column G. If you change any of the data that makes up column G you have to follow the above procedure to recaculate the FFT, it does not update automatically. These are complex numbers.
- J: Magnitude of the FFT to create a plot
- L: Inverse FFT of of the (complex) FFT results in I.
- M: Real portion of the IFFT to compare against the input and to plot
- O & P : FFT of G, just to show what happens when you don’t use the IFFT.
Things to watch out for when using Excel FFT for typical spectral analysis needs:
- The FFT’s processing gain is not corrected by Excel. Values should be divided by N/2 (i.e. one half the FFT size) to get the actual magnitudes
- The results are the full N point FFT, if the input data is real-only you’re probably only interested in the first N/2 points.
- The magnitudes will only be exact if the number of waveform cycles is an integer amount (i.e. the spectral peak matches a bin center). You need to do a curve fit to find the exact numerical value of the peak.
- Windowing the data helps in a lot of ways that are beyond the scope of this quick guide, but if you do remember to include the window gain correction factor. (likewise if you zero pad)
- The FFT RESULTS DO NOT UPDATE when you change the data. You must re-run the FFT by hand any time your data changes.
Need a quick refresh on Fourier stuff? This book chapter from Princeton is good. It appears to be part of these class notes, but who knows how long these links will be around.